Sorry for not writing this week, it was a good week to kick back and just observe the madness. Please go back and read my last post which was written exactly one week ago on Thursday evening during the Asian trading session. Shortly after that post was written the airstrikes started in Iraq, the S&P 500 crashed through 1900 all the way down to 1890 and the Dow Jones futures traded down to 16200. Take a look at what the markets have done since, here are the daily charts of the both major US stock indices


The Dow has rallied almost 500 points and the S&P 500 has surged over 60 points in one week. While this rally has ensued, other key markets tell a different story. If you have been reading me since last year, you have seen me refer to OIL and Copper as indicators for economic growth. Also I have been saying how the fall in OIL over the past 6 weeks may be telling us a story of slow demand. Take a look at the daily chart on OIL, it has broken down to the 9550 area now, I find this fall very interesting with all that is going in this world currently.
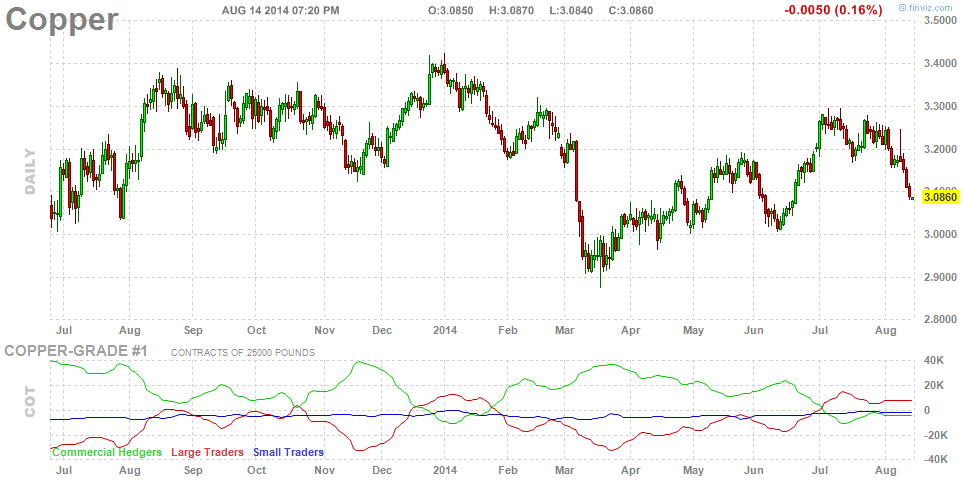
Next band of support in OIL prices should be the 92-93 dollar level. Next let's notice how Copper is not buying into this equity rally at least for this week. Take a look at this daily chart and notice how we are approaching the major support area of the $3 level.
Copper has been down every day this week! Oil and Copper along with the US 10 Year Note are telling a complete different story than what the equity markets are showing. Maybe it's just summer doldrums and the markets are just drifting along or maybe it's just that I am looking into things a little too much. Only time will tell, summer has only got 3 more weeks, I am looking forward to the markets picking up in volume soon, it has been a long long summer for most of us especially the currency crowd.
One last chart I want to show is the daily of the 10 Year Note, please notice how I showed this last week and pointed out how I thought the chart and price was saying FEAR.
With the surprising rally in stocks this week, this chart should look different than the way it is currently set up! Last week the rate was 2.41%, today the close was 2.40%. So while the stock gurus tout US stocks are the only game in town and that all is swell with the economy, other major markets are telling you something else! Stay tuned.
Sorry not to talk much about currencies or the metals but really, what is there to talk about? Gold has held $1300 all week making a high of 1325 or so and that's it. The US dollar closed today above 8160 again but has not traded higher than 8178. I mentioned last week that we may trade in a range until the 22nd of the month when we will hear from Janet Yellen in Wyoming, the dollar has been in a range from 8135 to 8175 all week and I have a feeling that's the range until next Friday. Sorry but I just cannot get excited about Gold until we take out 1335 to the upside and hold that level for at least 2 days and as far as the US dollar is concerned, I am looking for it to start rolling over in the near future as I just do not see the FED raising rates any time soon!
Enjoy your weekend, I'll have more on Gold and the currencies in the coming days. Thanks for reading.
TraderMartin


Really Mr .Martin Connolly you are well written in this blog . I Visit and See Your last Thursday post . I read and liked the post and have also bookmarked you.
ReplyDeleteStock Broker